Amid the third-quarter earnings reporting season, the major indexes were mostly negative over the last week. Global markets continue to weigh inflation and resultant monetary policies fueled further by OPEC+ announcement of reduction of oil output by 2M barrels per day starting in November.
Let us outline some of the major developments of the last week:
- The S&P 500 index gave up almost half of its gains since its March 2020 bottom and fell -56.59 to close at 3583.07 over the week.
- Producer prices rose 0.4% in September, double than expectation, reported by the Labor Department.
- Core consumer prices rose 6.6% in spetemeber’22 on a year-on-year basis, which was again more than expected.
- The two-year U.S. Treasury yield reached 4.5%, its highest since 2007 and the 10-year yield also rose over the week and moved above 4%. It is imperative to note here that Bond prices and yields move in opposite directions.
- Major indexes of Europe rose over the week. Italy’s FTSE MIB, Germany’s DAX index and France’s CAC 40 advanced 0.14%, 1.34% and 1.11% respectively. However, pan-European STOXX 600 Index ended little lower and UK’s FTSE 100 fell 1.89% over the last week.
- Japanese index Nikkei ended the four-day losing streak on Friday and gained 3.3% to finish the week at 27,091, almost flat for the week. The other broader index, TOPIX, closed at 1,898.
- The Japanese currency Yen continued to struggle against the soaring U.S. dollar as the dollar/yen exchange rate rose above 146, reaching 32-year low level.
- In China, Shanghai composite index and the blue-chip CSI 300 index gained 2.07% and 1.32% respectively, following positive comments from Chinses central bank and the Communist party.
- The 10-year Chinese Government bond fell to 2.719% after closing in September at 2.776%.
- The yuan traded at 7.191 per US dollar on Friday after hitting a 2-week low on Thursday. The currency has lost more than 10% against the green back this year and looks on track for its biggest annual loss since 1994.
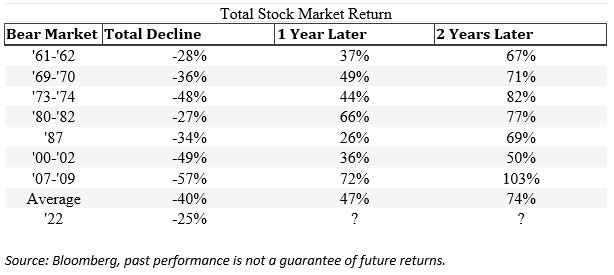
Let us analyze this interesting trend from the past after the bottom.

The above table suggests the stock market performance after the bear market ends and its favorable to investors. However, it is worth noting here that the average decline, previous bear markets have seen, is around 40%. If we omit the decline of mid-70s led by oil embargo followed by recession, the early-2000 caused by tech bubble plus 9/11 and the subprime crisis (2007-09) loss of around -57% then the average decline in the other bear markets was closer to 30% and we are pretty close to this figure.
Pullbacks are a normal part of investments process but we should be able to endure our losses. Are you ready to participate in this expected rebound, which seems not very far from here?
Sign up to receive weekly updates in your mailbox